<img src="https://secure.frog9alea.com/152419.png" alt="" style="display:none;">
Start a 30-day trial

Frequently Asked Questions

FAQ - General

Windows and panels can be hidden in the application in two different ways. Panels/windows are either closed completely or shown as minimized. In case of a closed window, you can use the button ‘Show window’ on tab VIEW. This will list all currently closed windows. Select the window that you want to open and it will reappear on its last position.

In case the panel/window is shown as minimised, it will be visible as a small tab on one of the sides of your application. Open the tab to show your panel and click on the small pin.

Manual:

https://docs.engageprocess.com/modeler/manuals/en-US/index.html?changing_program_layout.htm

On tab HELP you will find the buttons:

  • ‘Manual’: select this to open the online manual, including search option.
  • ‘Tutorials’: select this to open a tutorial that will guide you through all important features step by step.
  • ‘Videos’: select this to get a list of instruction videos on several subject to learn how to use achieve some results quickly.
  • ‘Ask a question’ : select this to ask a question to our support team.
  • ‘Report a bug’: select this if you ran into a bug and if you provide enough information we will do our utmost to solve it for you.
  • ‘Report a wish’: select this to send us your suggestions for improvement

Of course you can also contact us by e-mail. We prefer to receive all your questions and remarks on support@engage.nl.

Manual: https://docs.engageprocess.com/modeler/manuals/en-US/index.html?help.htm

After you selected ‘PROJECT | Printing / reporting | Download as PDF’ a dialog will appear that will assist you in creating the layout and content of the report. If you miss information, this is most likely the result of one of the following:

  1. In one of the screens you will be asked to select the step types that you want to include in your report. If you forget to select here e.g. Computer then all the steps of this type including all their property information will not be included in your report.
  2. In one of the screens you can select the properties that you want to include in your report. If you did not select e.g. Description here your report will not include descriptions for any of the proces steps.

Manual: https://docs.engageprocess.com/modeler/manuals/en-US/index.html?printing_and_reporting.htm

The application allows you to rearrange the panels to your own needs. You can reposition the panels of hide them (temporarily) by moving them to a sidebar.

You can move a window by clicking on the title bar of the window, keeping it pressed and moving the window to the desired location. Some icons will appear to support you in this process. If you move your pointer over one of the icons you can see a preview of where the window will be docked. When you release the mouse button the window will actually be moved.

To hide a window you can click the cross in the top right. In order to move a window the a sidebar you can click the pin in the window title bar. The window will be moved to the sidebar on its nearest side of the screen.

Manual: https://docs.engageprocess.com/modeler/manuals/en-US/index.html?changing_program_layout.htm

Open both (process) diagrams in the project pane by double clicking them. Each process is not visible in its own tab. However, the tabs are still stacked. Click on the tab title of the process that you would like to move (e.g. down) and keep it pressed. Now move the window to the area where you want to see it (e.g. at the bottom). After you release it you will see both processes at the same time.

Manual: https://docs.engageprocess.com/modeler/manuals/en-US/index.html?changing_program_layout.htm

FAQ - Modeler

The Process Modeler will automatically draw the arrows and position the process steps for you. This will simplify and speed up the drawing of the process for you so that you can focus on the process itself. However, especially for large and/or complex processes the result can be difficult to read. Some texts will be only partially visible and/or many crossing lines are shown. Some features for improving this are:

  1. Use the buttons in the group ‘Diagram font’ on tab ‘LAYOUT’ to reduce the text size so that you more text will fit in the reserved space below the step icons.
  2. Uncheck the option ‘Connections’ in the group Show/Hid on tab ‘LAYOUT’. This will hide all connections that are drawn from Go To steps to the destination.
  3. Use the functionality available on tab ‘DESIGN’ to manually customize the layout of the process.

Manual: https://docs.engageprocess.com/modeler/manuals/en-US/index.html?my_layout.htm

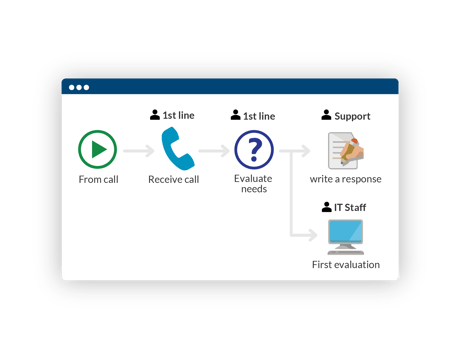
Double click on a task. The mini property editor will appear with Roles as one of the items. Select the button with the three dots. A dialog will appear where you can add multiple roles. The same dialog allows you to enter the number of participants for this task for each role.

The same can be achieved by using the Roles field in the property window or property table.

Manual: https://docs.engageprocess.com/modeler/manuals/en-US/index.html?participants_and_roles_of_a_me.htm

Yes, your work is always saved automatically.

Manual: https://docs.engageprocess.com/modeler/manuals/en-US/index.html?automatic_saving.htm

Both a choice/decision and a parallel will result in an extra branch in your process. However, when you use a choice/decision, during the execution of your process only one of the branches will be selected. When you use a parallel all branches will be executed in parallel

The difference between a choice and a decision is that a decision is a task and a choice combined. Therefore, you can also assign a role and other task properties to a decision.

Parallel branches can be connected or not connected. Connected parallel branches are branches that are executed simultaneously but all branches need to wait until they are all finished before the process continues. If you have not connected parallel branches, all branches will still be executed simultaneously, but when one of the (lower) branches is finished, this branch will end but the main process continues without waiting for the result of this parallel branch.

You can customize the layour of your process manually to make a long but narrow process fit on one page. You can use the features available on tab page DESIGN. Select the first process step that you would like to wrap to a new row below the other steps. Now select Wrap. You can repeat this – if needed – several times to make the horizontal process fit to your page.

Manual: https://docs.engageprocess.com/modeler/manuals/en-US/index.html?my_layout.htm

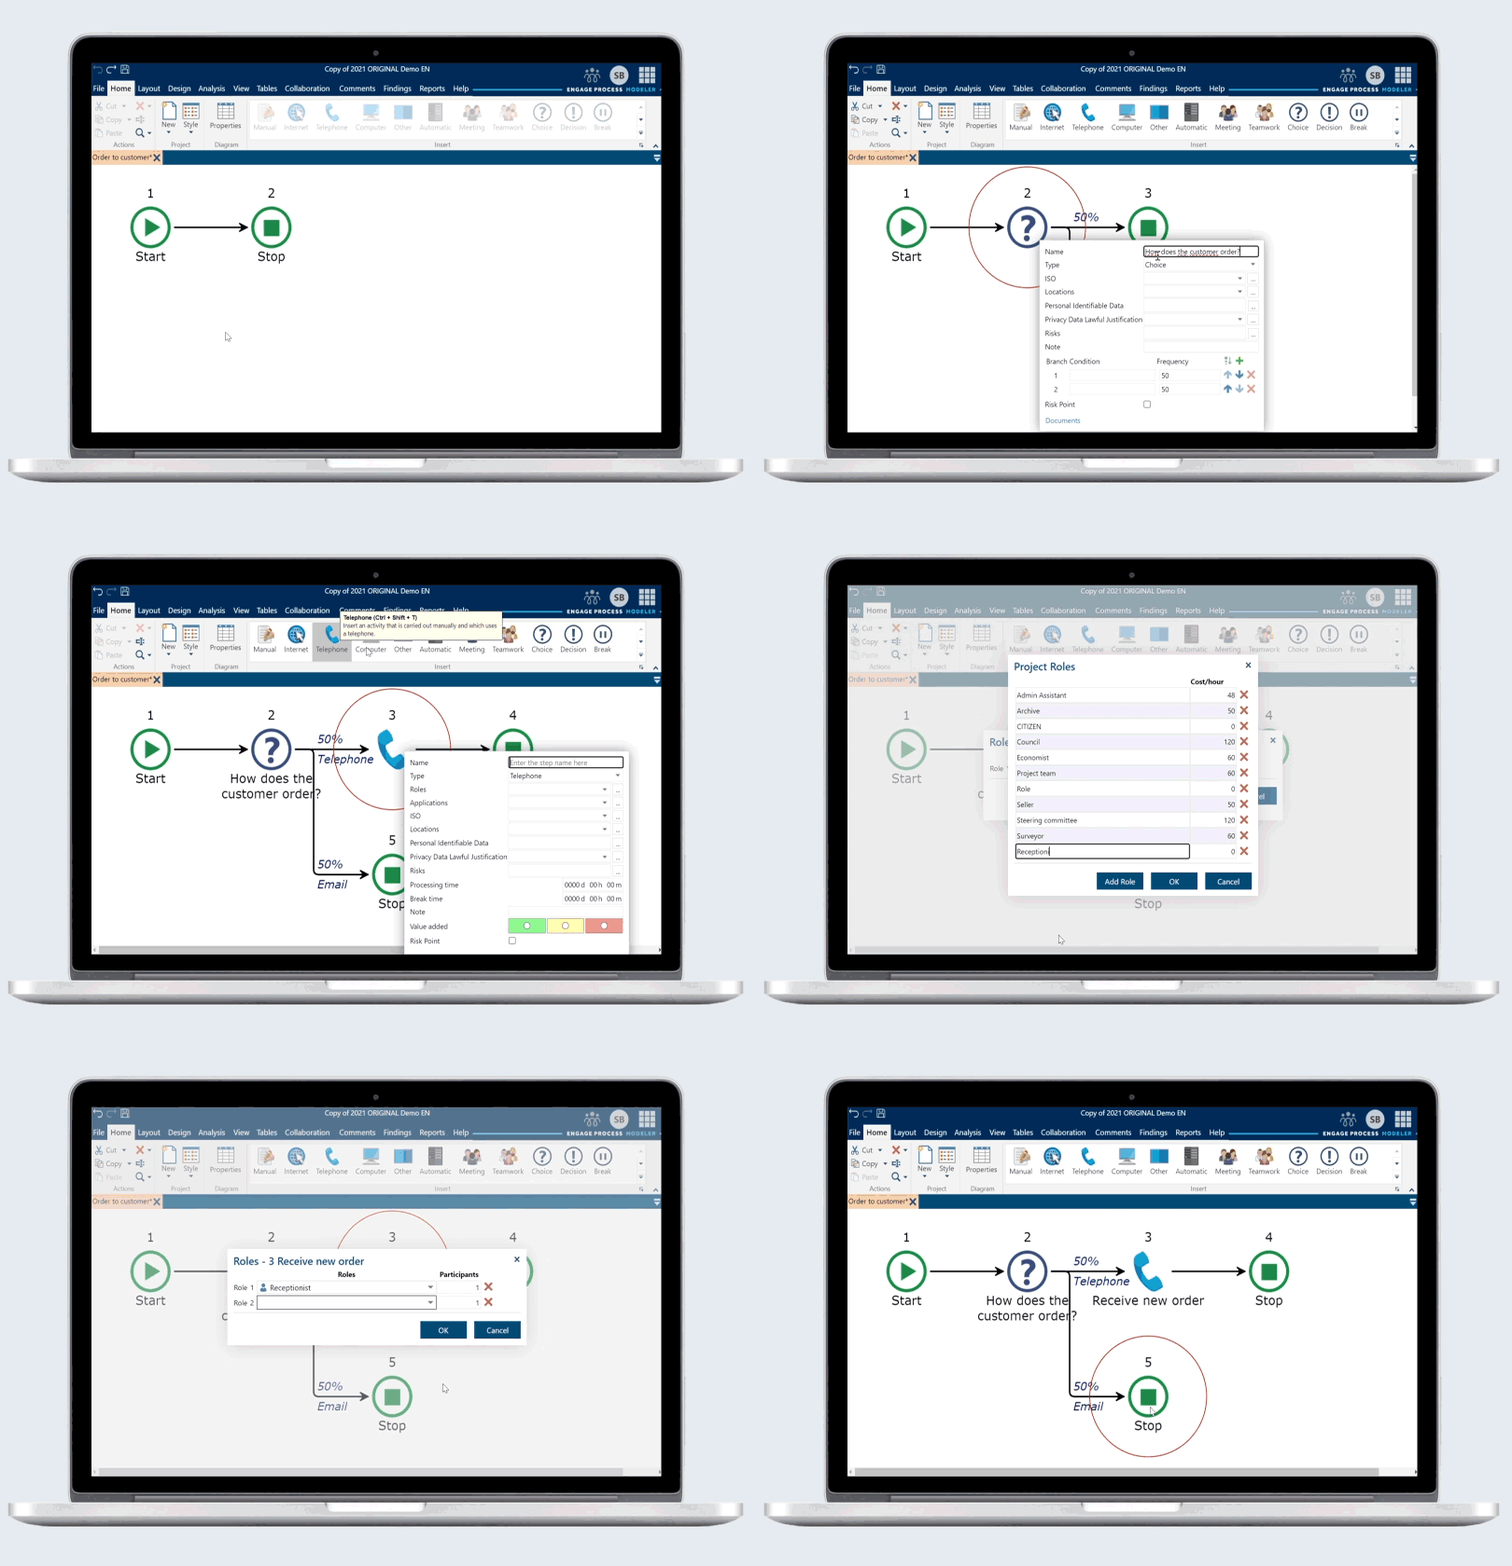
Open the context menu using the right mouse button and select ‘Add branch’. A new branch will be added below the existing branches.

Handleiding: https://docs.engageprocess.com/modeler/manuals/en-US/index.html?append_branch.htm

You can customize the layout of the process by using the features available of tab DESIGN. Using the buttons on this tab (and the extra diagram features that are available when this tab is selected) you can adjust many aspects of the layout: move steps, adjust the arrows, resize all text blocks, move texts or add your own additional texts or annotations.

Manual: https://docs.engageprocess.com/modeler/manuals/en-US/index.html?my_layout.htm

While you are mapping your process, the Process Modeler continuously checks if the process structure that you create is correct and valid. This is why some things cannot be mapped. One of these things is to have a process end in a parallel branch.

Why not? Assume that we have two parallel branches that are executed simultaneously and one of the branches would result in the end of the process. What should happen with the other branch? It would have to be aborted, but the when and how is not clear for the process. Therefore, this is not allowed. However, you can still end this specific parallel branch if you do not join this branch with the main process.

In a similar way, the modeler also does not allow you to create infinite loops or dangling (not connected) process steps.

Select the first step that you would like to have in a subprocess. Now, extend your selection with more steps. The fastest way to do this is to keep the key pressed and select the last step that you would like to have in your subprocess. All steps between the first step and last steps should be selected automatically, including any branches.

Now open the context menu (with right mouse button) and select ‘Create subprocess’. At that moment the begin and end of the new subprocess will be added to your diagram. You can collapse this subprocess by clicking on the minus symbol. All steps in your subprocess will now be ‘hidden’ inside the subprocess. When it is collapsed you can rename the subprocess..

Manual: https://docs.engageprocess.com/modeler/manuals/en-US/index.html?multiple_select.htm

The easiest way to solve this is with one of the following options:

  1. Use the buttons in the group ‘Diagram font’ of tab LAYOUT to adjust the tekst size. If you reduce the text size, more text will fit in the reserved space below the icons. If the resulting text is too small you can decide to zoom in on the whole diagram with the slider in the bottom right of the application.
  2. You can use the features of customizing the layout when the tab DESIGN is selected. Select the tab and then select the text. A selection rectangle will appear. This rectangle allows you to resize and reposition the texts.

Manual:

https://docs.engageprocess.com/modeler/manuals/en-US/index.html?zooming.htm

https://docs.engageprocess.com/modeler/manuals/en-US/index.html?font_in_diagrams.htm

https://docs.engageprocess.com/modeler/manuals/en-US/index.html?rearranging_steps.htm

You can score the steps in the process by means of how much value they add to the process from the customer perspective. Three values can be set:

  • Customer value added (green): this step is required for providing the service to the customer of for creating the product.
  • Business value added (yellow): This step is not required for providing the service or creating the product, but it is required to be able to execute the process. These steps cannot be eliminated but should be minimized.
  • None value added (red): This step is not necessary for providing the service or creating the product and it is not necessary for the process execution. This is referred to as ‘waste’ and these steps should be eliminated from the process.

After you scored all process steps, you can visualize the value added by each step by checking the box Value Added in group Show/Hide on tab LAYOUT.

If you cannot make any changes to your process, this is because:

  • You retrieved an older version of the project. This version will be available as ‘read-only’. You will also see this in the name of opened process. If you want to make this older version current you can select tab PROJECT and choose Recover this version. After you confirm the question you can continue to make changes.
  • You have a process link in your process and you expanded this process. After expanding the whole process will be set to ‘read-only’ since you are not allowed to change the linked process from within this process. Collapse the linked process and you can continue editing.

Manual:

https://docs.engageprocess.com/modeler/manuals/en-US/index.html?version_management_and_retriev.htm

https://docs.engageprocess.com/modeler/manuals/en-US/index.html?non_activities.htm

The Process Modeler allows you to enter tekst for you process or step in different places. You are free to use it however you want. However, below you can find some advice based on best practice..

Note:

For every step you can add a small note, e.g. ‘Is this time correct?’, ‘Did we assign the right role?’. This is often used as a small reminder or follow up action to finish the process map. You can make the note visible to check Notes in the group Show/Hide on tab LAYOUT. The note appears as a small sticky note above the step.

Description:

In the description field you can add a (short) explanation of what this process step is about. This field is also used to provide a work instruction on how to perform the task.

Remarks:

In the remarks field you can enter additional information like: points of attention, improvement suggestions and/or a description of the bottle necks.

Annotation:

It is possible to show the annotations that are connected to process steps on the diagram itself. Select tab DESIGN and select the step you want to add the annotation for. A text block appears with a line drawn to the related process step. You can customize the styling of this text block in the pane ‘Properties’. It is also possible to resize or move the annotations.

The modeler saves all your changes automatically. In case of any mistake you can always use the ‘Undo’ button at the top left. However, it could be that you made this mistake earlier that day or even several days ago. The undo button will not be of much help.

You can still revert to the correct previous version of your project. Select tab PROJECT and select Open (the default selection). Now select for ‘Previous versions’. You will see a list of previous versions that were kept including the date and time of creation. Select the version you want to retrieve and select Ok. Now you can check if this version of the project is what you want. You can copy from this project and paste in the latest version. You can also make this version of the complete project the current version. Select tab PROJECT and select ‘Recover this version’.

Manual: https://docs.engageprocess.com/modeler/manuals/en-US/index.html?automatic_saving.htm

In the Process Modeler all steps in the process will be numbered automatically. The advantage of this is that you do not have to make any changes when you add/insert steps. However, you can also assign a number (or any tag) to a process step yourself. Go to the properties pane and enter your own numbering in the field Tag. Repeat this for all the process steps. In order to see your own numbers/tags instead of the automatic numbers, go to group Show/Hide on tab LAYOUT and select All Options. In the dialog you check the field Tags. The automatic numbers will be replaced by your own numbers/tags.

A subprocess is a collection of process steps that are logically grouped and always part of the higher level process. A process link is a reference to another process and when this linked process is finished, the other process continues with the step after the process link

A subprocess is used when you want to cut a process in larger chunks to create a high level process and improve its readability.

A process link is used when you want to execute a process that you already mapped before. You will not have the map it again, but you can just refer to is. It will be similar to a subprocess. The main advantage of process links is that it enables you to create a process library and reuse processes in several higher level processes. You will have to make any future changes to this process in one location only.

A phase is a collection of process steps that are executed in a certain phase of a project. It is drawn differently to stress the sequential nature of phases. It is similar to a subprocess, but it has some unique characteristics.

  1. A phase can only be inserted in the main (top) process branch.
  2. A phase is drawn with a colored background.
  3. When you expand a phase, you will see its content in a vertical column with the same background as the collapsed phase. This way you can easily see what process steps are executed in what phase.

A phase is often used to visualize the tasks of a project that is about to be started in an organization so that each project member knows what is expected of him and at what point in time.

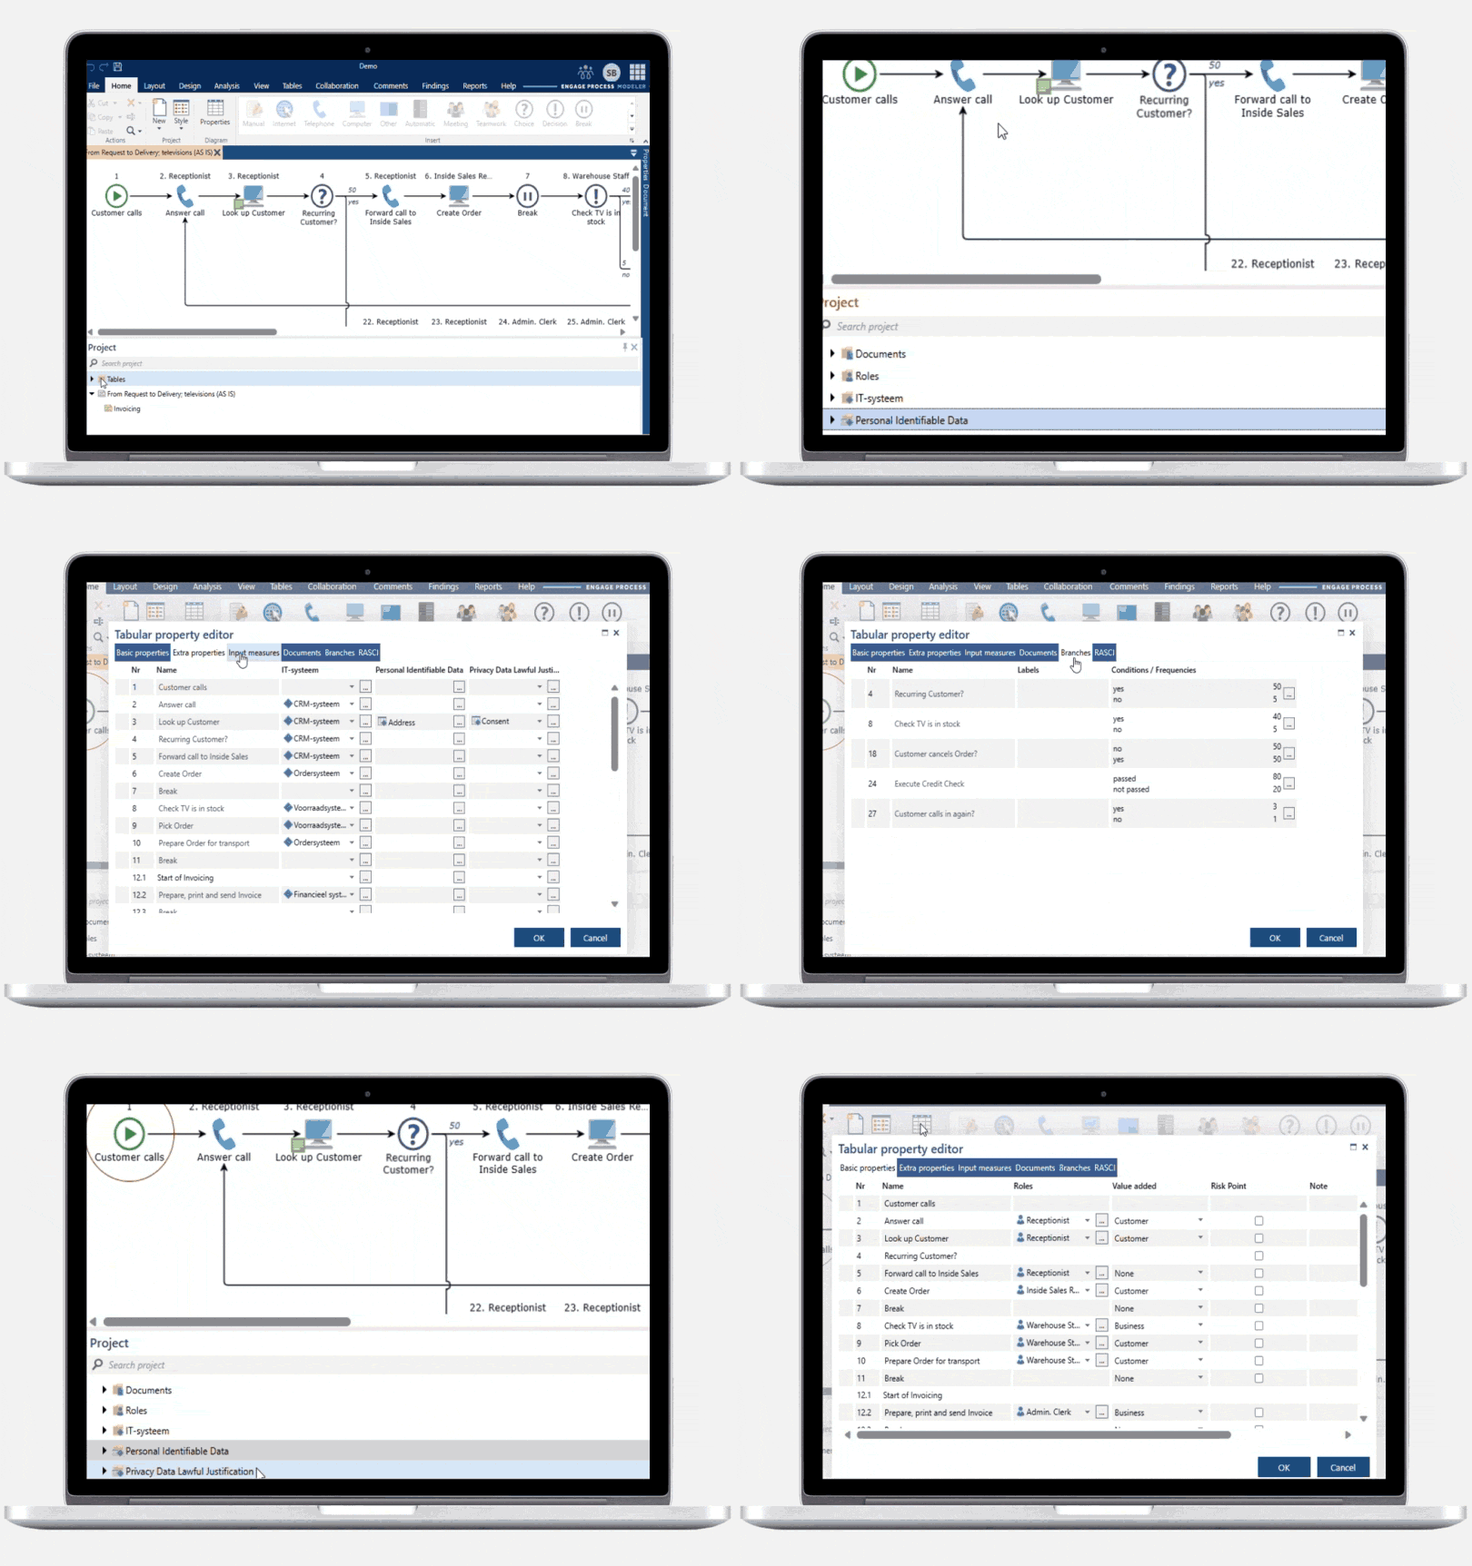
The tab ‘START’ shows a button ‘Properties’. Select it to open the ‘properties table’. This table shows an overview of many properties of all process steps in grouped in different categories (tabs). You can also edit the properties in this table.

Manual: https://docs.engageprocess.com/modeler/manuals/en-US/index.html?table_property_editor.htm

Your process can have multiple starts / triggers. You can map this as follows:

  1. You add a Choice as the first step of your process. This choice chooses between the different starts. So the Choice could be ‘How did we receive the request?’. Ever branch could indicate a possible channel like front-office desk, telephone, e-mail, etc.
  2. You can add a real additional start. Select the activity where the extra start branch will join the main branch and select Start from the step library. You can also add extra process steps between the new start and the place where it joins the main branch.

Manual:

https://docs.engageprocess.com/modeler/manuals/en-US/index.html?creating_entry_points.htm

https://docs.engageprocess.com/modeler/manuals/en-US/index.html?creating_parallel_start_branch.htm

Double click the step. A mini property editor will appear that shows all the branches. For each branch you can edit the label or frequency. It also allows you to change the order of the branches. You can do this manually with the blue arrows. For choices/conditions you can also sort all branches automatically based on their frequency value.

Manual: https://docs.engageprocess.com/modeler/manuals/en-US/index.html?reordering_branches.htm

Each branch for a choice/decision has its own Stop at the end. It is possible that one branch should join the main branch at a certain point in the process. The process will jump from one branch to another.

In order to achieve this, drag the stop icon from the branch and drop it on the step where the branches should join. The stop will change into a Go to step.

Manual: https://docs.engageprocess.com/modeler/manuals/en-US/index.html?creating_go_to.htm

Select tab ‘PROJECT’. Now select Options and select Ribbon. You will see a list of all available step types. Change the order using the arrow buttons and confirm.

Open the project and process that you want to copy. Now select Copy from the context menu or the Actions group in the ribbon. Now open the other project (or create a new one). Click anywhere inside the project pane and select ‘Paste’.

Each branch for a choice/decision has its own Stop at the end. It is possible that one branch should join the main branch at a certain point in the process. The process will jump from one branch to another. Assume that the destination step you want to jump to is inside another subprocess. You will first need to expand that subprocess. Both the stop of the first process and the destination need to be visible at the same time (not necessarily in the visible diagram area).

After expanding the subprocess(es), drag the stop on its destination. If the destination is not in the visible area, drag near the border of the diagram and the diagram will scroll automatically. After you drop the Stop will be changed into a Go To.

Manual: https://docs.engageprocess.com/modeler/manuals/en-US/index.html?creating_go_to.htm

Yes, the Modeler contains a brainstorm module. Open an existing project or create a new project. Press on tab HOME on the button Add and select Brainstorm. Next, give your brainstorm a name and an empty diagram appears for you to create your brainstorm. After you select the brainstorm diagram, the tab HOME will change. Instead of process steps you will now find buttons to create the notes for you brainstorm in different colors and to add rows and columns to your brainstorm.

Additionally, you can download our Brainstorm app in the App Store or Google Play store. Just search for Engage Brainstorm. With this app you can create notes and submit these to a brainstorm session. You can submit brainstorms to any active brainstorm session, even if the Modeler is not currently open. As soon as the brainstorm is opened again in the Modeler all submitted notes will be added to the brainstorm diagram.

Manual: https://docs.engageprocess.com/modeler/manuals/en-US/index.html?brainstorm_diagrams.htm

After mathematical analysis (e.g. Evaluate Process on tab ANALYSIS) you will find the results in the Results category of the property pane. I can happen that ‘suddenly’ all the results are cleared. Obviously this happens for a reason. If you make any change to your process after mathematical analsysis the results are cleared because it is very likely that the results no longer show the results for the modified process. E.g. if you increase the role rate or change the assigned roles to a step the total cost of your process will be invalid (and higher). To get the updated results you simply re-evaluate your process.

Manual: https://docs.engageprocess.com/modeler/manuals/en-US/index.html?evaluation.htm

The RASCI-model is a matrix that is used to define the roles and responsibilities of all the perons that are involved in a proecess. The S is shown in parenthesis because this is sometimes not used. A short explanation for each letter:

R = Responsible (R)         : this role is responsible for execution of the task

A = Accountable (A)        : this role is accountable fort he execution of the task

S = Supported                   : this role will help/support the execution of the task

C = Consulted (C)             : thie role needs to be consulted before or during the execution of the task

I = Informed: (I)                : this role will be informed during or after the execution of the task

How does it work?

  • Select an acitivty and define in the Properties pane in the category RASCI what role are involved. It is common that not all letters are defined and/or to have multiple roles per letter.
  • Select the right role by pressing the triangle or the dots button if you want the assign multiple roles.
  • In order to show the RASCI-matrices use the buttons on tab page REPORTS

Manual: https://docs.engageprocess.com/modeler/manuals/en-US/index.html?rasci_roles.htm

You can copy text from one field in another field, but you can also copy text from one application (e.g. Excel) into the Modeler (e.g. the description or remarks fields).

Follow these steps:

  • Select the text that you want to cut or copy using the mouse cursor.
  • Use the + of + key combinations or use right mouse button and select Cut or Paste. Depending on the language of your browser it is possible that you see these options in your preferred language.
  • Go to the field in which you would like to copy the text and use + or use right mouse button and select the option Paste.

P.S. Some web browsers have a built-in spell checker. This will also automatically check the text in the description and remarks fields.

You can link documents to process steps, e.g. the work instruction that explains how the task should be executed or a check list that needs to be used during execution of a task. Linking a document to a step can be done in several ways. Below you will find the two most common methods:

Via the process step:

  • Double click on the step you want to link a document to. This will open the mini propery editor.
  • Click the text Documents on the bottom left.
  • Fill in name and URL field in the window that appears and press OK.

Via het ‘Project’ pane:

  • Select the folder called Documents with the right mouse button in the project pane.
  • Select ‘Add’.
  • Select ‘Document’.
  • Fill in the name of the document and select OK.
  • The properties of this document are now shown in the property pane. Fill in the URL property if needed.
  • Link this document to a process step as described above.

To show the linked documents that have a URL in the Modeler you should show the Document pane. In the default layout this pane is shown on the right side of the screen. This pane will show the first linked document. If you have more linked documents, you can select the document to show using the drop down list at the top of the pane.

Via ‘PROJECT | Options | Top Options’ you can decide to show the documents as hyperlinks. This will shown only the name of the linked documents in the Document pane. When you click a name a new browser window will be opened to show the actual document.

The Modeler allows you to create extra properties. Most common examples are IT-Systems, Locations, Risks and/or Measures. To add your own property follow these steps:

  • Select tab HOME and press the button Add.
  • Select the option ‘Type’.
  • Now enter the name of your property, e.g. IT-Systems en press OK.
  • In the Project pane you will find a new folder IT-Systems in the Tables folder.
  • Doubleclick on the new folder IT-Systems.
  • A new dialog appears. Select Add IT-Systems.
  • Enter the name of the IT-system you want to add (and optionally the cost per hour).
  • Repeat this for every system you want to add and press OK when you are finished.

In the project pane you will see all the created IT-Systems in the folder with this name. You can link these systems to a process step by:

  • Double clicking a process step. The mini property editor appears.
  • Select the IT-System you want to link in the drop down list IT-Systems or use the button with dots to add multiple IT-systems to his step.

Manual: https://docs.engageprocess.com/modeler/manuals/en-US/index.html?custom_types.htm

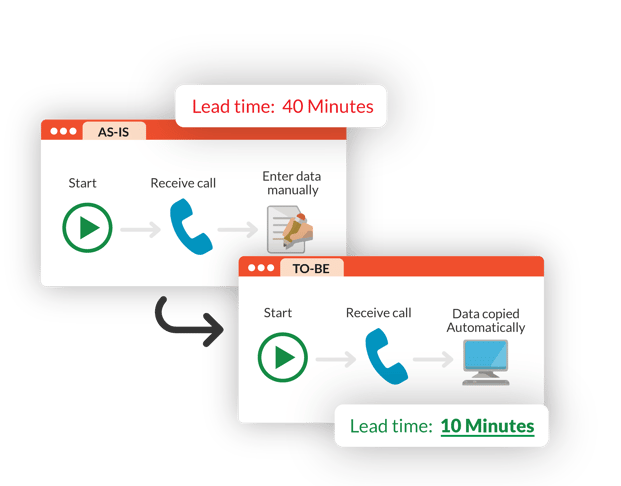
The lead time can be either calculated or entered. In the first case its value will be calculated based on the entered processing time and break time, in the latter you can enter the lead time value yourself. Follow these steps to make this possible:

  • Select the tab ANALYSIS and the button Settings in group Measures.
  • Select the option ‘Enter processing & lead time, calculate break time’ for the option Processing / lead time input and press OK.
  • In group Measures on tab ANALYSIS choose button Select.
  • Check – if not there – the measure Lead time in the left column in category Time and press OK.
  • Double click on an activity to open the mini property editor.
  • Now you can enter the value for Lead time.

Manual: https://docs.engageprocess.com/modeler/manuals/en-US/index.html?measures_settings.htm

In some cases the readability of your proces scan be improved by temporarily hiding some icons, e.g. the icons for parallel activities. Assume that you have a connected parallel in your process an icon is used to indicate the start of the parallel, an icon is used for the end of the parallel and in all branches except the main branch go-to icons are used for joining the branch to the end of the parallel. You can choose to hide all these icons as follows:

  • Select tab ‘LAYOUT’ and button ‘Modify Filter’.
  • Decide what icons you want to have hide. In our example we uncheck Join, Go to Join and Parallel.
  • Press OK. The filter is automatically activated.

Now you will see only lines instead of all the icons related to parallel.

Manual: https://docs.engageprocess.com/modeler/manuals/en-US/index.html?filtering.htm

In the Modeler it is possible to quickly get an insight in the decision tree of a process. With the decision tree we mean all choices/decisions in the process in the order of occurrence. We can simply see this on screen by using the process diagram filter:

  • Open the process for which you want to show the decision tree.
  • Select tab LAYOUT and button Modify Filter.
  • If all checkboxes are checked it is sufficient to choose Reversed filter and press Ok. Otherwise you can quickly check all boxes by checking Step Types at the top and the choose Reverse filter. Of course you can also uncheck all boxes and not use the Reverse filter..

The diagram will now only show the steps that are important for the process flow. This is very similar to the decision tree for your process.

Manual: https://docs.engageprocess.com/modeler/manuals/en-US/index.html?filtering.htm

After a mathematical analysis you can check the boxes in the pane Show measures to show the measures as a colores box above the step. These will be shown in one of three colors: red, green or yellow. By default these colors represent the following:

  • Red: the value of the measure is in the highest 25% range in relation to the interval from the lowest value to the highest value.
  • Green: the value of the measure is in the lowest 25% range;
  • Yellow: the value of the indicator is between the lowest and highest range;

Manual: https://docs.engageprocess.com/modeler/manuals/en-US/index.html?presenting_measures.htm

After your mathematical analysis of the process – e.g. by selecting Evaluate Process on tab ANALYSIS – you can see the results in category Results of the Properties pane. You will always see the results here for the selected process step. If you want to know the average results for the whole process you need to select the start of the process (= ‘Start’-icon). You will see the average results for all possible paths of the process, in other words, all possible routes from the begin of the process (Start icon) to the end of the process (Stop icon).

Obviously a process can also have multiple Starts or Stops. In that case, the average is calculated from all routes from all Start icons to all Stop icons. The average results for the whole process will then be shown in the property pane in category ‘Process results’..

Manual: https://docs.engageprocess.com/modeler/manuals/en-US/index.html?evaluate_process.htm

After your mathematical analysis of the process – e.g. by selecting Evaluate Process on tab ANALYSIS – you can see the results in category Results of the Properties pane. You will always see the results here for the selected process step. A process can have multiple ends (Stop icons). In other words, a customer can leave the process in different places. If you want to know the results is a customer leaves the process at one specific place you select the corresponding Stop icon and you will see the average results for all possible paths from the start of the process (Start icon) to that specific end of the process (Stop icon).

Manual: https://docs.engageprocess.com/modeler/manuals/en-US/index.html?evaluate_process.htm

FAQ - Settings

Within the Modeler you can use descriptive icons as process steps. This will increase the readability of your process. On the tab HOME you will find all the icons that you can use to map your process. However, it is quite possible that you miss a good icon for the activity that you would like to map. Or maybe you would prefer to change an existing icons or even hide an icon. The following procedure describes how to add icons:

  • Select ‘PROJECT | Options | Ribbon’. In this window you can change the order of the step icons on the HOME tab;
  • Now select the button ‘Create or manage icons and steps’ at the bottom of the screen. The Admin Center will open;
  • Click on the button ‘Create new step type’. A new window appears;
  • Enter all the details for the new step type. This includes the icon you would like to use. You can select an icon from our library or import your own image as an icon.

Manual: https://docs.engageprocess.com/modeler/manuals/en-US/index.html?adding_new_step_type.htm

Can't find your answer?

Contact the support team.

Easier, More Effective Business Process Management

Try the easier and more effective way of mapping processes, analysing them and driving improvements across your organisation. Get a free trial today

Start a 30-day trial